
Authors: Mathew Sijabat & Katya Loviana
Introduction
Income inequality is an enduring issue in economic development discussions, along with poverty. According to Karagiannaki (2017), inequality causes harmful effects to economic growth. Many researches have proved this hypothesis, including OECD’s (2014) which stated that a rise in inequality by 3 Gini points would reduce economic growth by 0.35 percentage points per year. Though often associated with poverty, income inequality differs as it takes into account the entire spread of income distribution whereas poverty only focuses on the lower part (Foster et al., 2013). OECD (2014) stated that the gap between lower income, more specifically the bottom four deciles, and the rest of the population is the biggest factor in inequality and growth relationship. Therefore, policies must address lower income generally, not only poverty.
Inequality’s negative impact on economic growth cause a growing research number on its relevance to multiple variables, including financial inclusion. Financial inclusion and income inequality commonly are negatively related. Despite being supported with various research, Demir et al. (2020) stated that this relationship might vary depending on other factors, such as the level of economic development. This motivates research that considers the various levels of economic development in countries which can be observed by using Organisation for Economic Co-operation and Development (OECD) countries’ data. In addition to that, financial inclusion still remains a big challenge in OECD countries, such as the financial literacy racial gaps in the United States and the limited access to financial services in Costa Rica and Mexico (Fareed et al., 2021). As the average income of the highest 10% level of income distribution is about nine times of the lowest 10% in OECD countries (OECD, 2017), observing financial inclusion and inequality in OECD countries becomes highly relevant.
One observation from the inequality data is that, while within-country income inequality has increased, between-country income inequality has decreased. Indeed, for the past 25 years, income convergence between developed and developing countries has been driven by the rapid growth of emerging market economies, such as China and India. Nonetheless, between-country income inequality is not an accurate portrayal of the disparities experienced by people on a daily basis. Today, an estimated 71% of the world population lives in countries that have experienced an increase in within-country income inequality since the 1990s. Interestingly, this increase has also been significant in developed economies. As shown by figure 1.1., the average annual income gap between the top and bottom deciles of the income distribution has been far more pronounced in developed economies such as the U.S. and the UK. According to the OECD (2015), this has been largely driven by the increasing concentration of wealth in the hands of the richest 1%.
Figure 1.1: Mean Incomes, Top and Bottom Deciles of Selected Countries, 2015
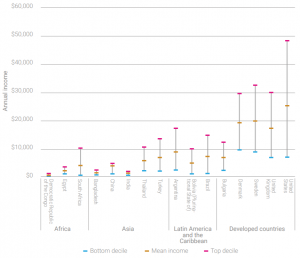
Source: UN DESA (2015)
How has this happened? Commonly cited reasons include globalisation, skill-biased technological growth, falling tax rates for the wealthy, as well faster growth in executive compensation (OECD, 2020). However, one factor is particularly relevant for our case: financialisation, which is the increase of the financial sector’s size and importance to the overall economy. For one, it has been observed that workers in finance tend to enjoy a considerable wage premium, in that they are paid much higher than workers of similar skill in other sectors (Cournede et al., 2015). Besides that, the increasing accessibility of credit tends to benefit high earners more, as they are more likely to have good credit scores, thus accessing cheap loans for investment. Likewise, as the wealthy are more likely to own company shares, stock market expansions have also disproportionately benefited them through capital gains and dividend payments (Blundell-Wignall & Roulet, 2014).
Despite the link between financialisation and inequality, fintech has seemingly become an exception to the findings. With increased digitization, fintech is capable of providing payments and remittance services at lower costs. Similarly, the usage of machine learning in alternative credit scoring models have provided previously underserved individuals access to cheaper loans. A few real-life examples stand out: Through its 2G platform, Kenyan fintech firm M-PESA have provided millions of unbanked Africans access to financial services. Similarly, IndiaStack has also helped many firms digitize their financial services through its open banking APIs. As such, the link between fintech, financial inclusion, and inequality will be explored further in the remainder of this paper.
Our reference study, Demir et al. (2020), suggests a few conclusions. First, fintech reduces income inequality through financial inclusion. Second, financial inclusion reduces income inequality at all quantiles where its effect is larger in upper quantiles. Demir et al. (2020) used a sample of 140 countries, consisting of low-, lower middle-, upper middle-, and high-income countries, using data from the 2011, 2014, and 2017 waves of the Global Findex survey.
Literature Review
Fouejieu et al. (2020) analyzed the impact of financial inclusion to income inequality using a large sample of developed and developing countries from 2004 to 2015. Two analyses were run with one conditional to the economics and macro-financial environment, adding few conditional variables, and one not conditional to those. The result showed that based on the full sample, improving access to financial services contributes in reducing inequality, with the impact not being independent from macroeconomic performance and macro financial conditions. Moreover, financial inclusion has a larger impact on inequality in countries that grow faster and have stable financial conditions. In conclusion, this paper suggests that financial inclusion is an important policy tool that could effectively contribute in reducing income inequality.
In line with previous paper, research conducted by Park and Mercado, Jr. (2017) showed similar results. The paper analyzed the impact of financial inclusion to income inequality from 2004 to 2012 in 176 economies, including 37 developing Asia, following Sarma’s (2008) indicators with adjustments to increase sample size. The result showed that there is a significant negative relationship between financial inclusion and income inequality, but only for the full sample, not for developing Asia. Results also showed that per capita income, rule of law, and demographic are important factors for financial inclusion in both samples. In conclusion, similar to the previous paper, Park and Mercado, Jr. (2017) also suggest that access to financial services could reduce income inequality in all levels of income.
Using data from 47 African countries, Bkwayep & Tsafack (2020) established that financial inclusion indirectly lowered income inequality through migrant worker remittances. For developing countries, remittances serve as a vital source of household income, in many cases even exceeding the size of official development assistance. Given that many remittance recipients are the rural poor, increased access to financial services allow them to reduce transportation costs that they would have spent, leaving more money for consumption smoothing, human capital investments, and entrepreneurship. Hence, ATM and bank branch penetration was found to be negatively correlated with the Gini coefficient. In addition, although digital banking was included as a control, its correlation with inequality was noticeably weaker.
Meanwhile, Ozili (2017) found a two-way causality between financial inclusion and fintech. On one hand, it was found that the poor tend to have lower financial literacy, meaning it is more likely for them to become users once they have been recommended by existing users as opposed to adopting it themselves. On the other hand, in communities with cultural aspects that hinders finance, the causal chain is reversed. This is because individuals who already own formal accounts are financially more literate. They are hence more capable of understanding and adopting fintech.
Beck (2020) stated that financial inclusion in developing countries is constrained by cost and risk that financial institutions are unable to overcome, whereas fintech has changed this problem drastically by reducing cost and allowing a more effective risk management. Mobile money became one of the most important financial innovations in developing countries as they reduce costs effectively and are accessible to a large part of the economy. Due to mobile money, almost all Asian Development Bank (ADB) countries’ account penetration increased significantly. An important note is that most financial innovations have been driven by private sectors rather than government, meaning that it is driven by profit rather than social interests. Other than that, there has been an initial focus on the numbers of accounts rather than the usage of it, which questioned the real impact of fintech to financial inclusion.
Frost et al. (2020) wanted to analyze how the usage of mobile banking affected the level of financial wealth and returns, and whether the effects contributed to wealth inequality. It was found that at all income levels, households with higher access to mobile banking also experienced higher returns on their financial deposits, leading to greater accumulation of wealth over time. However, it was also found that households at higher income deciles experienced higher returns to their deposits, even controlling for access to mobile banking.
Mentioned by Ferri and Acosta (2019), digitalisation enables marginal consumers to receive easy and cheap access to traditional financial services. Their paper focused on empirical evidence on the link between finance and inequality, whereas FinTech became one of the instruments in linking those two variables. It was mentioned that FinTech can reduce concentration of businesses which will ease smaller entities to enter the market and reach previously unreachable places to financial services. Through cashless digital transactions and peer to peer lending platforms, FinTech is mentioned to have increased efficiency and expanded access in developing areas.
Methodology and Data
To analyze the relationship between fintech and financial inclusion towards within-country inequality, we collected data from a panel of 33 OECD countries in 2014 and 2017 from Standardized World Income Inequality (SWIID), Global Findex Database, UNDP Human Development Data Center, and World Bank. Developed by Demir et. al (2020) in their study of 140 countries in 2011, 2014, and 2017, the regression model we adopted is as follows:
Figure 1.2: Regression Equation
![]()
Source: Demir et al. (2020)
In the above equation, our dependent variable is represented by Inequality, measured by the Gini coefficient of disposable income ranging from 0 (perfect equality) to 100 (perfect inequality). For our regressors, we have two explanatory variables of interest: Use of financial technology (Fintech) and degree of financial inclusion (Financial_inclusion). Fintech is proxied by the percentage of adult population (15+) using mobile phones to pay bills; and financial inclusion is proxied by three indicators measuring the access and usage of formal financial services, namely: Account, Saving, and Borrowing, which are the percentage of adult population (15+) owning an account, currently saving money, and currently borrowing funds at a formal financial institution, respectively.
In addition, to ensure the measured effects are not caused by external factors, a set of control variables represented by X are used: School, which is the national secondary school enrollment rate; Trade, which is the sum of exports and imports as a portion of GDP; GovExp, which is government spending as a portion of GDP; Inflation, which is the annual percentage change of the consumer price index; PopGrowth, which is the annual percentage change in total population; and GDPgr, which is the annual percentage change in GDP. Furthermore, the error term is represented by ui, which we assume to satisfy the normality assumption with mean of zero and variance of one.
The set of variables we are going to use in this empirical analysis as well as their sources are explained in Figure 1.2. From the dataset, the summary statistics are shown in Figure 1.3. Prior to analysis, we conducted some modifications to the data, due to a significant amount of missing values, by omitting the year 2011 from our sample. We also omitted Australia, Iceland, Japan, and the Netherlands due to missing values in some variables. In addition, we also interpolated Schooling in 2014 for Switzerland. As a result, the sample we used for analysis is a two-period panel of 33 countries, as opposed to a three-period panel of 37 countries that was used by Demir et al. (2020).
Figure 1.3: Variable Description
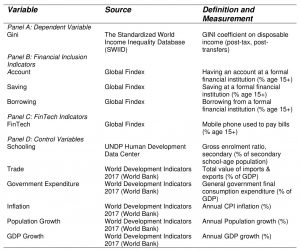
Source: Author’s Own Work
Figure 1.4: Summary Statistics
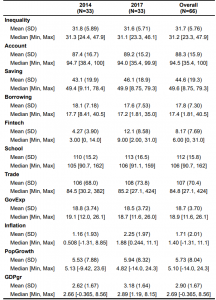
Source: Author’s Own Work
Furthermore, Demir et al. (2020) also implemented a quantile estimator as adopted from Altunbas & Thornton (2019). The estimator is obtained by solving the following optimization problem:
Figure 1.5: Quantile Estimator
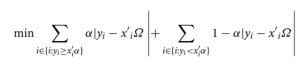
Source: Demir et al. (2020)
Where the above expression gives the quantile estimator for the 𝛼-th quantile (0 < 𝛼 < 1), with yi as the dependent variable, and xi as a k by 1 vector of explanatory variables. The reason for running a quantile regression is to account for potentially different effects of fintech and financial inclusion on income inequality across countries with varying inequality levels.
In replicating Demir et al. (2020) findings, our econometric strategy is twofold. First, we are going to use panel fixed effects regression in regressing income inequality on fintech, a set of control variables, as well as the financial inclusion indicators of accounts, savings, and borrowings. There are several reasons why we chose to use fixed effects as opposed to pooled OLS, including the existence of heterogeneity bias, which arises due to the correlation between the explanatory variables and unobserved effects. Thus, using pooled OLS would lead to biased and inconsistent estimates.
Second, we are going to regress inequality against the same set of variables, with the difference being the financial inclusion indicators individually regressed at the 10, 25, 50, 75, and 90 percent quantiles. There are two motivations for using quantile regression as opposed to mean-based regressions. First, based on Koenker (2005), quantile regression is fitting for dependent variables that may have a skewed or multimodal distribution. As such, using mean-based regressions would be misleading as it relies on the mean to measure centrality of the distribution. Second, we are also interested in the effects of fintech at different levels of the inequality distribution. By separating within-country inequality at different quantiles, we can observe whether or not fintech affects countries with high and low levels of inequality differently, which may give us more insights for policy implications. If we were to use mean-based regressions, this would not be possible as it treats countries of different quantiles equally in terms of fintech’s effect on inequality.
Figure 1.6: Sample Histogram with Kernel Density Estimation and Normal Distribution
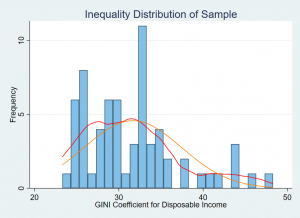
Source: Author’s Own Work
As shown in the kernel density estimation in Figure 1.6, our data has a multimodal distribution and is skewed, verifying quantile regression as the fitting method of estimation. In addition, as mentioned by Demir et al. (2020), one concern for this model is endogeneity. This may arise due to the reverse causality between on one hand, fintech and financial inclusion, and on the other hand, income inequality. In addition, there may also be various confounding factors present. To remedy this, we included the set of controls that are commonly used in fintech and income-inequality literature in both fixed effects and quantile regressions (Mookerjee & Kalipioni, 2010; Hermes, 2014; Lacalle-Calderon et al., 2019).
Econometric Results
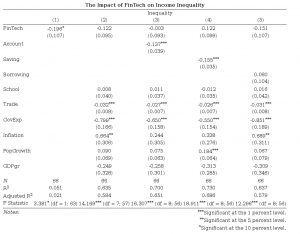
Figure 1.7 presents the fixed effect regression results for income inequality. The first two columns show the regression on fintech only, then fintech with control variables, respectively. From the first column, fintech is correlated significantly with inequality, negatively, at 10% significance level. However, when control variables are added, fintech’s negative correlation becomes insignificant. In column (3)-(5), we included additional variables for financial inclusion (account, saving, borrowing) into the regressor that was regressed individually.
Column (3) presents the results for when account is added into column (2). Estimated coefficient for account is significant at 1% significance level and negatively correlated with inequality. Though fintech estimated coefficient reduced from -0.122 to -0.003, it can’t be concluded yet that fintech affects inequality through an intermediary of account ownership at a formal financial institution as the result in column (3) is insignificant.
Column (4) exhibits results after adding saving into column (2). The result shows that saving is negatively correlated with inequality at 1% significance level. However, fintech shows an insignificant positive correlation with inequality which differs from Demir et al. (2020) results.
Column (5) displays the result for estimation when borrowing is added to column (2). Here, borrowing shows an insignificant positive correlation with inequality whereas fintech also shows insignificancy, but negative correlation with inequality. Having shown anomaly compared to Demir et al. (2020) results, our findings implies that financial inclusion is still debatable regarding its importance in being an intermediary through which fintech adoption affects income inequality.
In general, significantly, financial inclusion in terms of account and saving show negative correlation with inequality whereas financial inclusion in terms of borrowing show otherwise. Our result on borrowing is not in line with Demir et al. (2020) as their findings prove a negative correlation. Regarding magnitude, it can be interpreted that a one point increase in fintech adoption will; reduce income inequality by 0.003 when adding account, increase income inequality by 0.122 when adding saving, and reduce income inequality by 0.151 when adding borrowing, though more samples are needed as none result show significance. Moreover, our overall model shows a jointly significant correlation with inequality as all of the F-test are proven to be significant. Control variables also behave largely as expected in Demir et al. (2020) results which indicate that our control variables play a significant role in reducing income inequality.
In conclusion, proxied with mobile phone used to pay bills (% age 15+), fintech affects inequality, proxied with Gini coefficient, negatively and significantly. However, when financial inclusion variables (formal account ownership, savings, and borrowings) are added individually, the relationship becomes insignificant, and even positive for saving. This indicates that fintech is still uncertain in affecting inequality through financial inclusion as more samples are needed.
Figure 1.7: Panel Fixed Effects Regression
Source: Author’s Own Work
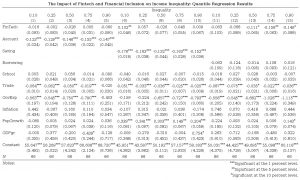
Having shown that fintech has inequality-reducing effects, we are now going to examine this effect for countries at different levels of inequality. Figure 1.8 shows our quantile regression results for 33 OECD countries when using the three different proxies of financial inclusion. In columns (1) to (5), the variable account is used as a proxy for financial inclusion, where the signs of the coefficients on accounts are negative at all quantiles, which is consistent with our results in Figure 1.7. Thus, at all quantiles of the inequality distribution, an increase in the proportion of the population owning an account at a formal financial institution is associated with a reduction in inequality. Although the coefficient signs are in line with Demir et al. (2020), the magnitudes of the inequality-reducing effects slightly differ. In the original study, the effect of formal account ownership on inequality strictly increases as we move up to higher inequality quantiles. In our findings, the effect only increases up until the 75th percentile, after which the coefficient decreases in magnitude. Given all account coefficients are significant at the 1% level, we can reject the null hypothesis that all regression quantile coefficients on account are equal. However, given the coefficients on fintech are not statistically significant, we could not conclude that mobile payments have inequality-reducing effects when account ownership is used as a proxy for financial inclusion.
Figure 1.8: Quantile Regression
Source: Author’s Own Work
In columns (6) to (10), we proxied financial inclusion using the variable saving, in which the coefficients on saving are negative at all quantiles. This is consistent with figure 1.7, verifying that formal saving does have inequality-reducing effects at all quantiles. However, unlike the original study, formal savings does not increasingly reduce inequality in more unequal countries. Rather, our results show that formal savings reduce inequality the strongest at the 10th percentile, and the least strong at the 50th percentile. Given the coefficients are all significant at the 1% level, we can reject the null hypothesis that all regression quantile coefficients on saving are equal. For our findings on FinTech, only the 10th quantile was statistically significant, where we found that 1-percentage point increase in mobile payments leads to a 0.102-percentage point reduction in income inequality.
Finally, columns (11) to (15) shows the quantile regression results when borrowing is used as a proxy for financial inclusion. Interestingly, our results are not entirely in line with figure 1.7, where it was predicted that an increase in formal borrowing is associated with an increase in inequality. Based on our quantile regression results, an increase in formal borrowing only reduces inequality up until the 50th percentile, with the largest effect occurring at the 25th percentile. On the other hand, when we move to the upper parts of the inequality distribution, an increase in borrowing becomes associated with an increase in inequality. However, these coefficients are not statistically significant. We thus fail to reject the null hypothesis that all regression quantile coefficients on borrowing are equal. Our results show that using borrowing as a proxy for financial inclusion yielded more statistically significant results on FinTech. We found that FinTech had statistically significant inequality-reducing effects at the 50th, 75th, and 90th percentile. This effect appears to be strongest at the 75th percentile, where a 1-percentage point increase in mobile payments leads to a 0.158-percentage point decrease in income inequality.
As shown by the green lines in figure 1.9, both the coefficients on account and saving are negative at all quantiles. Whereas for borrowing, the coefficient values are positive in the upper parts of the inequality distribution. One key observation here is that the quantile coefficients provide more insight on the inequality-reducing effects of fintech and financial inclusion according to the level of inequality a country has. Had we used mean-based regression instead, the coefficients on each explanatory variable would have been constant across all quantiles, as suggested by the black lines.
Figure 1.9: Plots of Mean and Quantile Regression Coefficients with Confidence Intervals
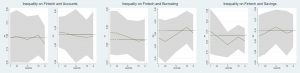
Source: Author’s Own Work
In sum, our results show that increasing financial inclusion is associated with a decrease in income inequality at all quantiles, specifically via formal accounts ownership and formal savings. As shown by Figure 1.8, a 1-percentage point increase in account ownership leads to a 0.123-percentage point reduction in the Gini coefficient, for countries at the 10th percentile. Whereas for countries at the 90th percentile, the same increase in account ownership leads to a reduction of 0.147-percentage point. Likewise, increasing formal savings by 1-percentage point leads to a 0.176- and 0.152-percentage point reduction in the Gini coefficient, for countries at the 10th and 90th percentile respectively.
However, due to the statistically insignificant results on borrowing, we did not have sufficient evidence to conclude that increasing formal borrowing leads to a reduction in income inequality. This is in contrast to the findings of Demir et al. (2020), whose estimated coefficients on account, saving, and borrowing were statistically significant and negative at all quantiles. One possible explanation for this is that the countries in the OECD are predominantly developed, with a high degree of financial deepening. According to Aron (2018), the adoption of fintech in developed countries are mostly linked with pre-existing bank accounts, where new innovative offerings are likely to serve banked individuals. On the contrary, in emerging markets with shallow financial depth, fintech are more likely to serve unbanked individuals. This may have negative implications for borrowing, as the unbanked have poorer credit scores.
Limitations of the Study
Our study still has limitations. Based on the countries we analyzed, our sample is limited only to OECD countries which consist of developed countries with high-income economies and high human development index. On the other hand, Demir et al. (2020) included both developed and developing countries that also resulted in more sample numbers. Moreover, from our panel data sample, we eliminated four countries and the 2011 period due to incomplete data availability.
Conclusion and Policy Implications
In proving our hypothesis, we collected samples from 33 OECD countries with two time periods of 2014 and 2017, eliminating four OECD countries and one time period due to data availability. Replicating Demir et al. (2020) econometrics method, we first used panel fixed effects regression in regressing income inequality on fintech, a set of control variables, as well as the financial inclusion indicators of accounts, savings, and borrowings. Then, we also used quantile regression by regressing inequality on the same set of variables, but regressing financial inclusion indicators individually at the 10, 25, 50, 75, and 90 percent quantiles.
Compared to Demir et al. (2020), several results differ. Using panel fixed effects regression, our results only showed significance in fintech towards inequality that was regressed solely. Moreover, our regression on inequality with including saving as a financial inclusion indicator and a set of control variables showed a positive correlation between fintech and inequality. Variable borrowing also showed a positive correlation with inequality using panel fixed effect regression, which we also found in our quantile regression results. Other than that, borrowing showed statistically insignificant results. The differences shown between our results and Demir et al. is based on different samples where ours only include 33 OECD countries with high-income economies and high human development index and we also omitted one time period. Furthermore, it might differ, specifically on borrowing variable, due to OECD countries’ characteristic of high degree of financial deepening, in which their initial financial inclusion’s condition make innovative fintech serve banked individuals rather than the unbanked.
In conclusion, our results using panel fixed effect regression showed that fintech affects inequality, though it is still uncertain for fintech to affect inequality through financial inclusion negatively when proxied using account and borrowing, and positively when proxied using saving. Then, financial inclusion, measured by account and saving, reduces inequality whilst increasing inequality when measured by borrowing. However, since not all show significance, concluding that more samples are needed. When regressed using quantile regression, fintech is still uncertain in affecting inequality through financial inclusion at all quantile levels. Nevertheless, financial inclusion reduces inequality at all quantiles, specifically via formal accounts ownership and formal savings.
Our study has several policy implications. First, given our fixed effects results, governments should focus on leveraging financial technology as one of the tools of reducing income inequality. Second, we also found that not all proxies of financial inclusion have inequality-reducing effects. Though increased access (Accounts) and supply-side usage (saving) can lower inequality, the same cannot be said for demand-side usage (borrowing). Thus, policymakers should look further into factors that may limit borrowing to high-income countries, as the result suggests. Finally, as shown by the quantile regression results, fintech and financial inclusion do not affect inequality the same way for countries of different inequality levels. This suggests that simply providing access and usage to financial services does not suffice, as policymakers should also tackle structural and institutional factors that affect inequality.
References
Beck, T. (2020). Fintech and Financial Inclusion: Opportunities and Pitfalls. ADBI Working Paper Series 1165. Retrieved from https://www.adb.org/publications/fintech-financial-inclusion-opportunities-pitfalls.
Bkwayep, Y. R. N & Tsafack, R. N. (2020). Remittances, Financial Inclusion, and Income Inequality in Africa. Munich Personal RePec Archive, MPRA Paper No. 99684. Retrieved From https://mpra.ub.uni-muenchen.de/99684/
Demir, A., Pesqué-Cela, V., Altunbas, Y. & Murinde, V. (2020). Fintech, financial inclusion and income inequality: a quantile regression approach. The European Journal of Finance. doi: 10.1080/1351847X.2020.1772335.
Demirgüç-Kunt, A., Leora, K., Dorothe, S., Saniya, A., and Hess, J. (2018). The Global Findex Database 2017: Measuring Financial Inclusion and the Fintech Revolution. World Bank: Washington, DC.
Fareed, F., P. Lenain, E. Sunel, and D. Sutherland. (2021). Financial Inclusion: Challenges in OECD Countries. Retrieved from https://oecdecoscope.blog/2021/01/05/financial-inclusion-challenges-in-oecd-countries/.
Ferri, G. and B. A. Acosta. (2019). Sustainable Finance for Sustainable Development . Center for Relationship Banking and Economics Working Paper Series, 30. Retrieved from https://repec.lumsa.it/wp/wpC30.pdf.
Foster, J. S. Seth, M. Lokshin and Z. Sajaia. (2013). A unified approach to measuring poverty and inequality: Theory and Practice. The World Bank. doi: https://doi.org/10.1596/978-0-8213-8461-9.
Fouejieu, A., Sahay, R., Cihak, M., & Chen, S. (2020). Financial inclusion and inequality: A cross-country analysis, The Journal of International Trade & Economic Development, 29:8, 1018-1048, DOI: 10.1080/09638199.2020.1785532.
Hermes, N. (2021). Does microfinance affect income inequality?. Review of Development Economics. doi: 10.1080/00036846.2013.864039
Karagiannaki, E. (2017). The Empirical Relationship Between Income Poverty and Income Inequality in Rich and Middle Income Countries. Centre for Analysis of Social Exclusion (CASE). Retrieved from https://sticerd.lse.ac.uk/dps/case/cp/casepaper206.pdf.
Koenker, R. (2005). Quantile Regression. Cambridge University Press. doi: 10.1017/cbo9780511754098
Mookerjee, R. & Kalipioni, P. (2010). Availability of financial services and income inequality: The evidence from many countries. Emerging Markets Review, Elsevier, vol. 11(4), pages 404-408.
Organisation for Economic Co-operation and Development. (2014). Focus on Inequality and Growth. Retrieved from www.oecd.org/social/inequality-and-poverty.htm.
—–. (2017). Inequality and Income. Retrieved from http://www.oecd.org/social/inequality.htm#income.
Ozili, P. K. (2018). Impact of digital finance on financial inclusion and stability. Borsa Istanbul Review, 18(4), 329-340. doi:10.1016/j.bir.2017.12.003
Park, C. and R. V. Mercado, Jr. (20157. Financial Inclusion, Poverty, And Income Inequality. The Singapore Economic Review. DOI: 10.1142/S0217590818410059.
Solt, F. (2019). The Standardized World Income Inequality Database, Versions 8-9. Harvard Dataverse, V5. doi: 10.7910/DVN/LM4OWF.
UNDP. (2020). Human Development Reports Data Center. United Nations Development Programme. Retrieved 16 May 2021 from: http://hdr.undp.org/en/statistics/understanding/sources